
Mastering Calculation Groups in Power BI
Inkey Solutions, February 25, 2025531 Views
One of the most powerful features in Power BI is Calculation Groups. They allow you to reduce redundant calculations and enhance the flexibility of your reports. If you often find yourself writing multiple measures for different time-based calculations (such as YTD, QTD, MTD, YOY), then Calculation Groups are the ultimate solution.
In this blog, we will explore:
- What Calculation Groups are
- How to create and use them
- A practical example with time intelligence
- Advanced use cases and best practices
What Are Calculation Groups?
Calculation Groups in Power BI simplify measure management by enabling dynamic calculations. A Calculation Group in Power BI eliminates the need for multiple DAX measures by allowing you to define time-based calculations like YTD, MTD, QTD, and YOY once and apply them dynamically to any KPI, such as Sales, Revenue, or Profit. This reduces redundancy and improves efficiency in report development.
How to Create a Calculation Group
Step 1: Create a Calculation Group in Power BI Desktop
With recent updates, you can now create Calculation Groups directly in Power BI Desktop without needing Tabular Editor.
- Open your Power BI file.
- In Model view, click on New Calculation Group under the Modeling tab.
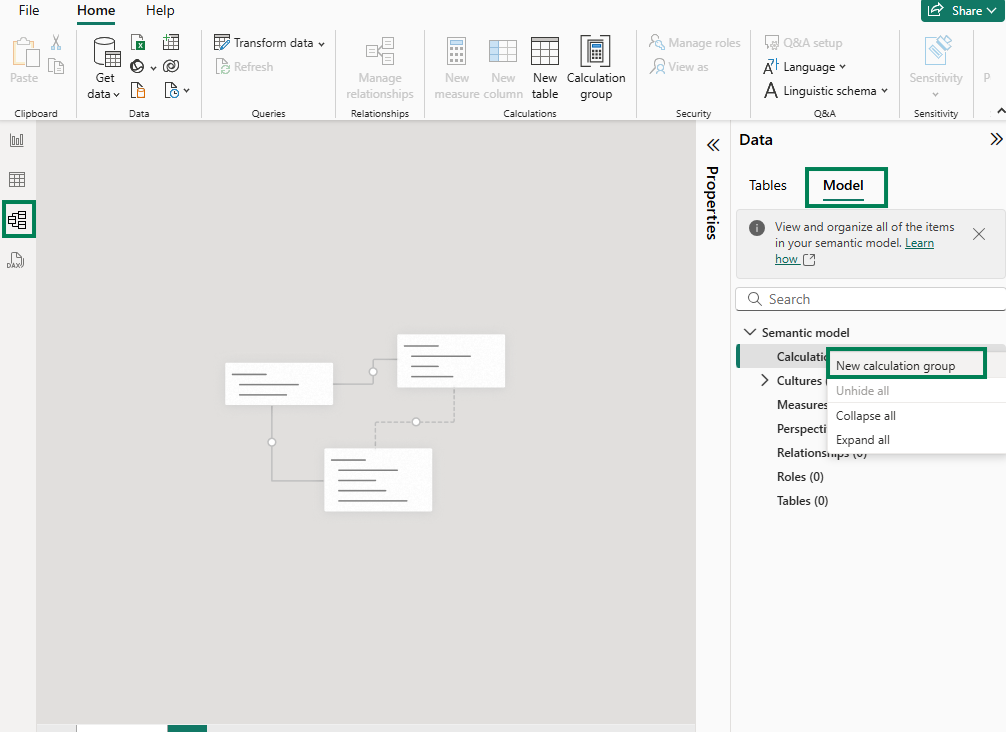
- Name the Calculation Group (Ex: Time Intelligence).
Step 2: Define Calculation Items
A Calculation Group consists of multiple Calculation Items. Each Calculation Item represents a specific transformation, such as YTD, MTD, etc.
- Inside the Calculation Group, create Calculation Items:
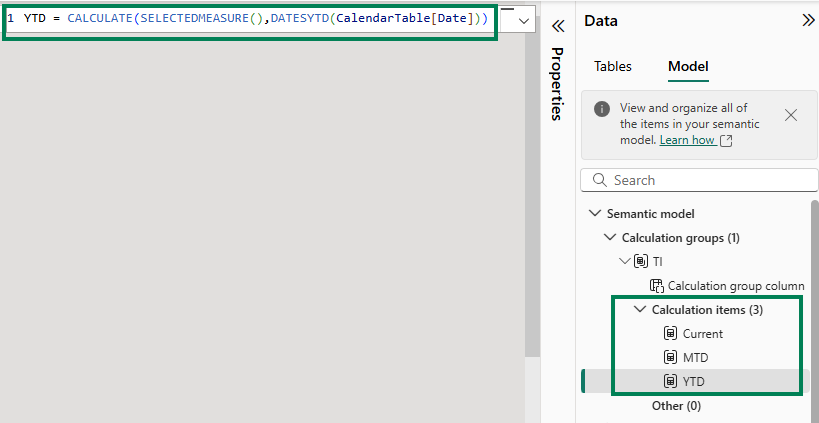
- Year-to-Date (YTD):
CALCULATE(SELECTEDMEASURE(), DATESYTD(‘Date'[Date]))
- Month-to-Date (MTD):
CALCULATE(SELECTEDMEASURE(), DATESMTD(‘Date'[Date]))
- Quarter-to-Date (QTD):
CALCULATE(SELECTEDMEASURE(), DATESQTD(‘Date'[Date]))
- Year-over-Year (YOY):
CALCULATE(SELECTEDMEASURE(), SAMEPERIODLASTYEAR(‘Date'[Date]))
Save and apply changes.
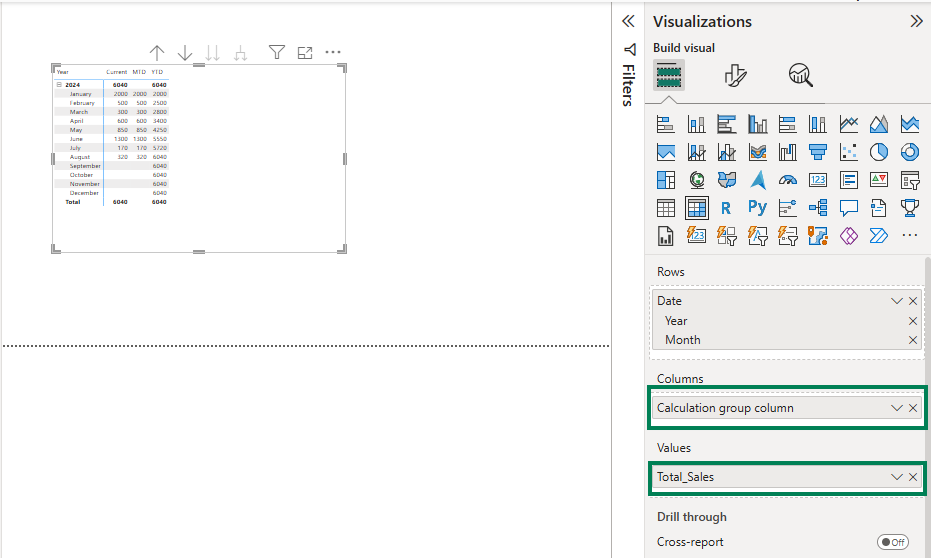
Step 3: Use Calculation Groups in Power BI
- Go back to Power BI Desktop.
- Drag the Time Intelligence Calculation Group into your table or matrix visual.
- Add any measure, such as Total Sales, and watch it dynamically update based on the selected calculation.
Benefits of Using Calculation Groups
- Reduces Redundant Measures – Instead of creating separate YTD, MTD, QTD measures for each metric, you create a single Calculation Group.
- Improves Performance – Since fewer measures exist in the model, Power BI optimizes calculations better.
- Enhances Report Flexibility – Users can toggle between different time-based calculations dynamically.
Advanced Use Cases
- Custom Formatting for Each Calculation Item
You can apply different number formats using the Format String Expression:
IF(SELECTEDVALUE(‘Time Intelligence'[Name]) = “YOY”, “0.00%”, “#,##0”)
This ensures that YoY values display as percentages while others show whole numbers.
- Creating Dynamic Measures Beyond Time Intelligence
You can use Calculation Groups for:
- Currency Conversions (e.g., switching between USD, EUR, GBP)
- Unit Conversions (e.g., switching between KG, LBS, Tons)
- Variance Analysis (e.g., Actual vs Budget, Actual vs Forecast)
Best Practices for Using Calculation Groups
- Use Meaningful Names – Name Calculation Groups clearly to avoid confusion.
- Limit the Number of Calculation Items – Too many items can slow performance.
- Test Performance – While Calculation Groups optimize your model, complex expressions might slow queries.
- Ensure Proper Relationships – Calculation Groups work best with a well-structured date table.
Conclusion
Calculation Groups are a game-changer for Power BI professionals looking to streamline their DAX formulas and enhance report efficiency. By implementing them, you reduce clutter, improve performance, and provide users with a more dynamic experience.
If you haven’t explored Calculation Groups yet, start experimenting today in Power BI Desktop and see how they revolutionize your Power BI reports!


