
Optimizing Power BI Reports with Performance Analyzer
WebSiteAdmin, March 7, 202594 Views
Struggling with a slow Power BI report? You’re not alone. Slow performance is often caused by complex calculations, inefficient data models, or an overload of visuals.
Power BI Performance Analyzer can help identify these bottlenecks and guide you toward a smoother, faster report.
What is Power BI Performance Analyzer?
- A built-in tool in Power BI Desktop that helps measure how long each visual and query takes to process.
- It highlights slow calculations, rendering delays, and areas that need optimization.
- By analyzing its insights, you can make data-driven decisions to improve performance.
Getting Started with Performance Analyzer
- Open Power BI Desktop and navigate to the View tab.
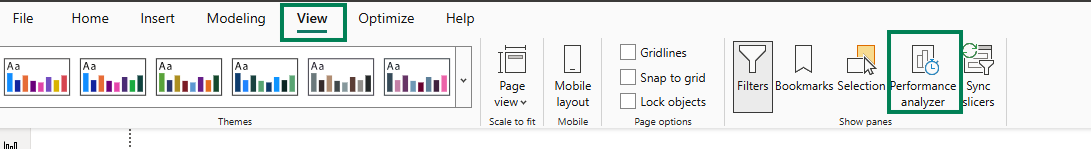
- Click Performance Analyzer to launch the tool.
- Hit Start Recording, then interact with your report—apply filters, switch pages, or refresh visuals.
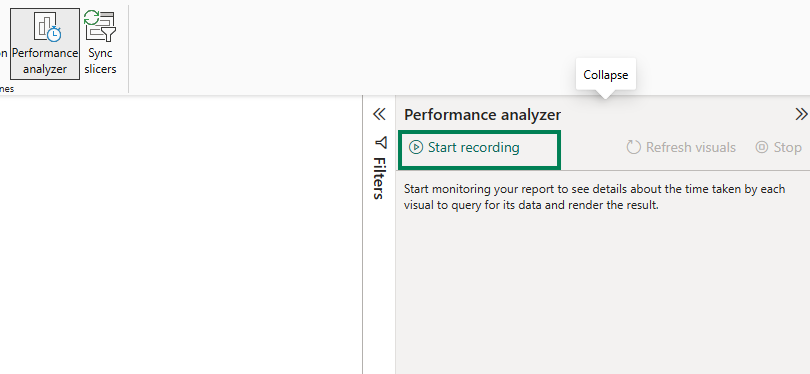
- Stop recording to see detailed breakdowns of each action’s execution time.
Breaking Down Performance Metrics
Performance Analyzer categorizes performance into three key areas:
- DAX Query Time – The time it takes for Power BI to process your calculations. Slow execution suggests optimization opportunities.
- Visual Display Time – The duration needed to render visuals on the screen. Complex visuals can slow things down.
- Other Processes – Any background tasks affecting report performance, including interactions and data refresh.
How to Speed Up Your Power BI Reports
Optimize DAX Calculations
- Use variables in DAX to store values and avoid redundant calculations.
- Reduce row-by-row operations in SUMX, FILTER, and CALCULATE functions.
- Eliminate unnecessary calculated columns when measures can achieve the same result.
Refine Your Data Model
- Structure your data using a star schema rather than a single massive table.
- Remove extra columns, particularly those with large text values.
- Utilize aggregations to precompute summaries and speed up report queries.
Enhance Visual Performance
- Keep the number of visuals on a page to a minimum—too many charts slow things down.
- Replace complex visuals with simpler alternatives when possible.
- Apply pre-filters to limit data before rendering instead of relying solely on slicers.
Boost Query Efficiency
- Switch to Import mode instead of DirectQuery if feasible, as it’s faster.
- Optimize Power Query transformations to avoid unnecessary processing.
- Enable query folding so database queries handle transformations instead of Power BI.
Exporting Performance Data for Further Analysis
- Export performance logs as a JSON file to analyze results outside of Power BI.
- Share logs with your team to collaborate on performance improvements.
- Regular monitoring helps track progress and validate optimizations.
Final Thoughts
Performance Analyzer is an essential tool for anyone looking to fine-tune their Power BI reports. By identifying bottlenecks, optimizing DAX queries, refining data models, and simplifying visuals, you can create reports that run faster and provide a seamless user experience.
Instead of guessing why your report is slow, let Performance Analyzer show you exactly where improvements are needed!


