
Using Bookmarks and Selection Pane for Interactive Reports in Power BI
Inkey Solutions, March 28, 2025109 Views
Power BI provides powerful features to enhance user interactivity, and two of the most effective tools for this are Bookmarks and the Selection Pane. These features allow you to create interactive reports, toggle between different views, and customize user experiences without complex coding. In this blog, we will explore how to use Bookmarks and the Selection Pane to build dynamic Power BI reports.
What are Bookmarks in Power BI?
Bookmarks capture the current state of a report, including:
- Visibility of visuals
- Filters and slicers applied
- Page navigation
By using bookmarks, you can create buttons to switch between different views, highlight key insights, or navigate users to different parts of the report.
What is the Selection Pane?
The Selection Pane controls the visibility of visuals within a report. This is useful when creating layered views, toggling visuals on and off, and managing complex report layouts efficiently.
How to Use Bookmarks in Power BI
Step 1: Enable the Bookmarks Pane
- Open your Power BI report.
- Go to the View tab and check Bookmarks Pane.
- Click Add to create a new bookmark.
- Rename the bookmark appropriately (e.g., “Sales Overview”).

Step 2: Modify the Report View
- Apply necessary filters, slicers, or hide/show visuals using the Selection Pane.
- Update the bookmark by clicking the ellipsis (…) next to it and selecting Update.

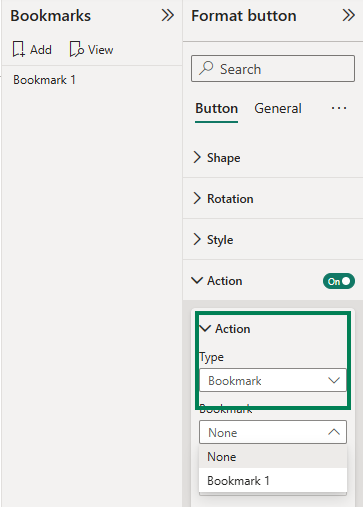
Step 3: Assign Bookmarks to Buttons
- Insert a Button or Image from the Insert tab.
- Under the Action section in the Format Pane, set the action type to Bookmark.
- Select the desired bookmark from the dropdown.
- Test the button by clicking it in View Mode.
How to Use the Selection Pane
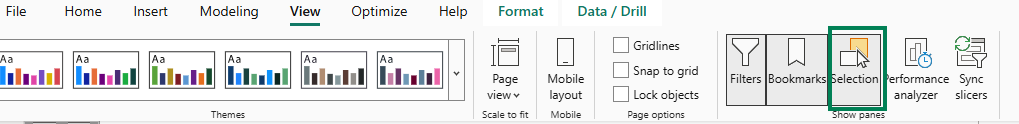
Step 1: Enable the Selection Pane
- Go to the View tab and check Selection Pane.
- A list of all visuals in the report will appear.
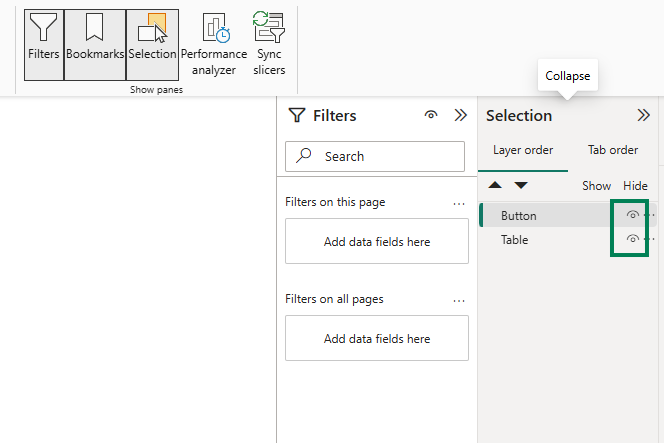
Step 2: Show/Hide Visuals
- Click the eye icon next to a visual to hide or show it.
- Use this feature to create layered visuals that can be toggled using bookmarks.
Example: Creating a Toggle Between Chart Views
Step 1: Arrange Two Charts
- Place Sales by Region chart and Sales by Product chart in the same location.
- Open the Selection Pane and hide one of them.
Step 2: Create Two Bookmarks
- Bookmark 1: Show Sales by Region, hide Sales by Product.
- Bookmark 2: Show Sales by Product, hide Sales by Region.
Step 3: Assign Bookmarks to Buttons
- Create two buttons labeled “View by Region” and “View by Product”.
- Assign respective bookmarks to each button.
Now, clicking each button will toggle between the two chart views dynamically.
Best Practices for Using Bookmarks and Selection Pane
- Group visuals logically using the Selection Pane for easier management.
- Use consistent naming conventions for bookmarks and visuals.
- Combine bookmarks with slicers to create dynamic drill-down views.
- Test in View Mode to ensure expected interactions.
Conclusion
Using Bookmarks and the Selection Pane in Power BI significantly enhances user interactivity by enabling toggling between visuals, filtering views, and customizing navigation without needing complex DAX or scripting. By following these steps, you can create a more engaging and intuitive reporting experience for users.


