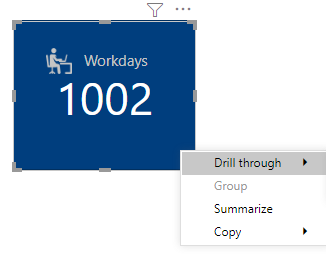
In Power BI, a drill–through feature permits the report consumer to peer detailed facts associated with the primary page in the context of a particular data point applied.
With drill via Power BI reports, one can create a detailed report page on your data that focuses on a particular applied data point. When the readers want to analyze a particular record or data point using drill-through, they right-click on a specific data point on the diagram or chart and drill through to the targeted page.

In Power BI reports, drill through from cards is a usual requirement in modern reports. Initially, Power BI didn’t provide out-of-the-box capabilities for that. To resolve this issue, we used to have a transparent stacked/bar chart on top of the card visual so that users can click on it and get the drill through option. But this workaround requires extra effort to manage the design and arrangement of the visuals. In the last week, while working on drill through again, we accidentally discovered that now the card visual supports this out-of-box.
Microsoft Fabric, Power BI, Microsoft Business Intelligence, SQL Server, and Business Central. By the power of these services, from advanced analytics to seamless business integration, we’ve got the expertise you need to optimize operations and drive growth. Harness the potential of your data infrastructure with our comprehensive suite of solutions.
Let’s see how we used to configure the drill through from the card step by step in an easy and understandable manner.
The oldest solution is by creating a 100% stacked bar chart using the same field as the card, making it transparent, and placing it on the top of the card visual.

Here in the above solution, the DAX measure used to fill transparent color, in the stacked bar chart is given below:
White Trans = "#FFFFFF00"
The main disadvantage of this solution/method is that it will be very difficult to create and manage multiple charts, cards, and slicers for the purpose of a single drill through, and also it reduces the overall report performance in cases when we have multiple cards plotted.
This solution was used until the drill through action is introduced in a button.
In March 2020, Power BI introduced the ‘drill through‘ feature as an action of the button click. So, after this update, we used this feature to overcome card drill through the facility by using a blank button on the top of the card visual. Here, you need one chart to select a data point to pass the context filter to another page.

In the above solution, we do not need to create any extra measure for button transparency.
This method is also less effective when there are multiple cards required with drill through because it’s difficult to manage multiple cards with buttons on them and it may affect our report performance.
However, Power BI has finally released this feature (silently though!)
In September 2020, Power BI introduced the ‘Native drill through‘ feature on card visual. But somehow it was not mentioned in the official blog post. So, after this update, we found this feature more effective than other methods for the drill-through from the card visual itself.

Things to keep in mind while working with the above method:
1. You cannot use direct fields in the card to drill through. It is always a measure.
2. The measure you put in the card visual and the measure you put in the drill-through field should be the same every time to use the drill-through feature.
The major advantage of this method/solution is that it reduces the complexity of handling too many buttons, charts, etc. additional visuals. For this method to work, you will only need one card and one measure.
So here we are done with drill through on card visual. Use these methods to create interactive and amazing reports.
Happy Learning!
© All Rights Reserved. Inkey IT Solutions Pvt. Ltd. 2025
Leave a Reply