
Power BI > Dynamic Scales & Values
WebSiteAdmin, August 31, 201913889 Views
Hello DAX-sters!
We have already created a report where we can choose what data we can show – dynamically. You can refer to the blog here.
How about we get the freedom to choose even how the data can be shown, i.e. weekly, monthly, quarterly, or yearly?
Every so often we need the availability of a custom visual of a bar chart or line chart which gives us an option to whether plot the chart weekly, monthly, quarterly, or yearly. Unfortunately, there are no custom visuals available (as per my search) neither does Power BI provide us with any alternative visuals.
I have come up with a trick which not only lets you choose how to show your data on X-axis i.e. either weekly, monthly, quarterly, or yearly but also lets you choose which data to show on Y-axis.
Please note that this approach might add a little bit more data to your model. If your data is already exceeding the data limit, you need to think about this approach.
Let’s create a report which has a slicer that lets you choose whether to show data weekly, monthly, quarterly, or
yearly. Also, it lets you choose which data to show(here, Sales and Order) as shown below:
For illustration purposes, we’ll have data on Sales and Order over 2 years.
Let’s start with building some supporting tables.
For the Sales Data, we have a Fact table – FTSales.
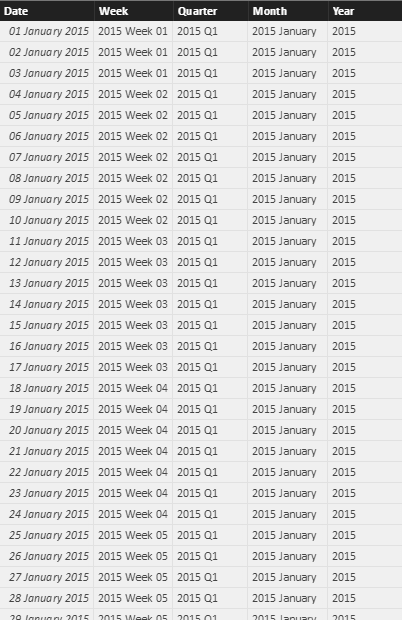
And then, we will have the Dates table(DTDates), which can be created by the following DAX formula:
Date:
CALENDAR(DATE(2015,01,01),DATE(2016,12,31))
The table is also required to have the following calculated columns with their corresponding formulae:
Year = YEAR(DTDates[Date])
Month = DTDates[Year]&" "&FORMAT(DTDates[Date],"MMMM")
Quarter = DTDates[Year]&" " & CONCATENATE("Q",ROUNDUP(MONTH(DTDates[Date])/3,0))
Week = DTDates[Year]&" "&CONCATENATE("Week ",RIGHT(CONCATENATE("0",WEEKNUM(DTDates[Date])),2))
DTDates table should look like this:
For total Sales and total Order, let’s create basic measures which we would need for plotting:
Total Order = SUM('FTSales'[Order])
Total Sales = SUM('FTSales'[Sales])
With this, we have a basic structure with the Fact table and Date table ready for use. However, we will need to add more tables for this technique to work. Let’s see why we need them & how to build them.
To pick the values for the Slicer, we need to have two dimension tables as in the below images:
For VALUE slicer, we need to have a table, let’s name it ‘DTDynamicSlicer’ which has the following items:
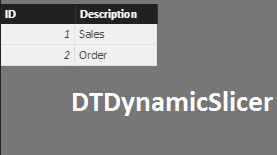
Once done, we would now need a table which bridges the gap between Dimension tables and Fact table.
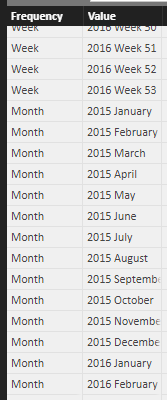
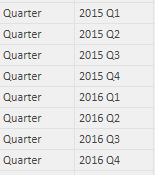
Hence, to bridge the gap, we need to create a table(let’s name it DateSlicer Table) with a value of each week with the word ‘Week’, value of each quarter with the word ‘Quarter’, same for monthly and yearly.
Hence, here we have data of two years, so records with word ‘Week’ will be (52+52), records with word ‘Quarter’ will be (4 + 4), records with word ‘Month’ will be (12+12) and records with word ‘Year’ will be (1+1).
It can be created using the following DAX formula:
DateSlicer =
UNION (
    SUMMARIZE ( DTDates, DTDates[Week], "Frequency", "Week" ),
    SUMMARIZE ( DTDates, DTDates[Month], "Frequency", "Month" ),
    SUMMARIZE ( DTDates, DTDates[Quarter], "Frequency", "Quarter" ),
    SUMMARIZE ( DTDates, DTDates[Year], "Frequency", "Year" )
)
Let’s rename the column ‘Week’ of DateSlicer table as ‘Value’.
The table would somewhat look like this depending on the data:
![]()
Now, we need to create relationships between Dateslicer table and FTSales table.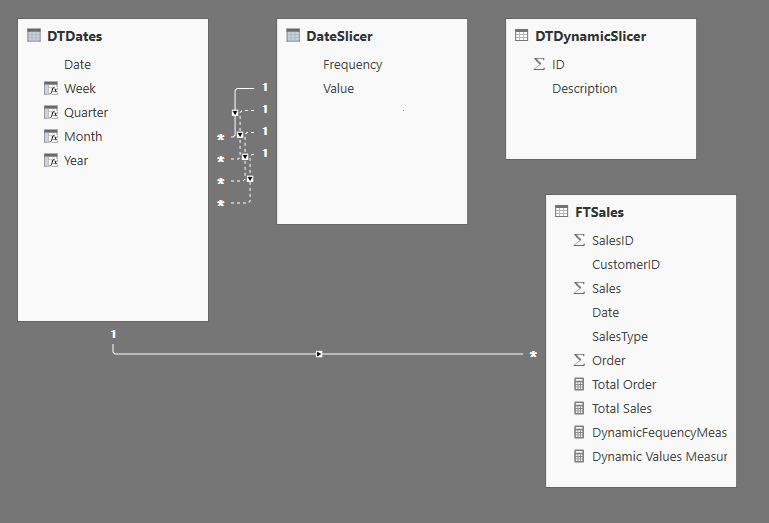
Now, we need to create a measure that calculates Total Order when selected ‘Order’ and Total Sales when selected ‘Sales’.
Dynamic Values Measure =
IF (
    HASONEVALUE ( DTDynamicSlicer[Description] )
        && SELECTEDVALUE ( DTDynamicSlicer[Description] ) = "Order",
    [Total Order],
    IF (
        HASONEVALUE ( DTDynamicSlicer[Description] )
            && SELECTEDVALUE ( DTDynamicSlicer[Description] ) = "Sales",
        [Total Sales]
    )
)
Also, we need to create a measure that calculates weekly, quarterly, monthly and yearly as and when selected.
DynamicFequencyMeasure =
IF (
    HASONEVALUE ( DateSlicer[Frequency] )
        && SELECTEDVALUE ( DateSlicer[Frequency] ) = "Week",
    CALCULATE (
        [Dynamic Values Measures],
        USERELATIONSHIP ( DateSlicer[Value], DTDates[Week] )
    ),
    IF (
        HASONEVALUE ( DateSlicer[Frequency] )
            && SELECTEDVALUE ( DateSlicer[Frequency] ) = "Month",
        CALCULATE (
            [Dynamic Values Measures],
            USERELATIONSHIP ( DateSlicer[Value], DTDates[Month] )
        ),
        IF (
            HASONEVALUE ( DateSlicer[Frequency] )
                && SELECTEDVALUE ( DateSlicer[Frequency] ) = "Quarter",
            CALCULATE (
                [Dynamic Values Measures],
                USERELATIONSHIP ( DateSlicer[Value], DTDates[Quarter] )
            ),
            IF (
                HASONEVALUE ( DateSlicer[Frequency] )
                    && SELECTEDVALUE ( DateSlicer[Frequency] ) = "Year",
                CALCULATE (
                    [Dynamic Values Measures],
                    USERELATIONSHIP ( DateSlicer[Value], DTDates[Year] )
                )
            )
        )
    )
)
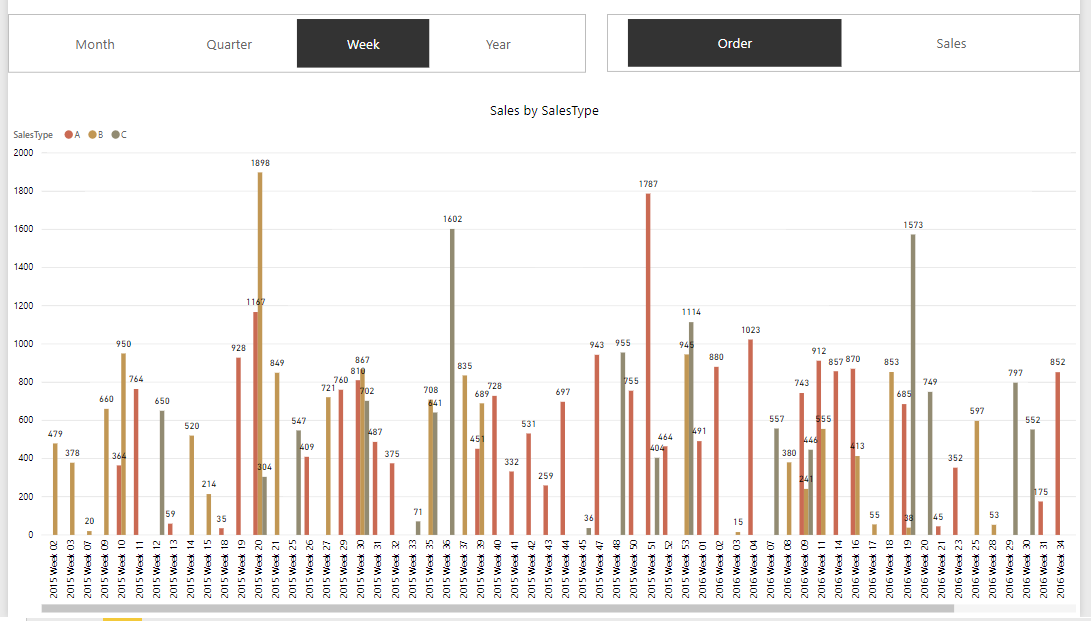
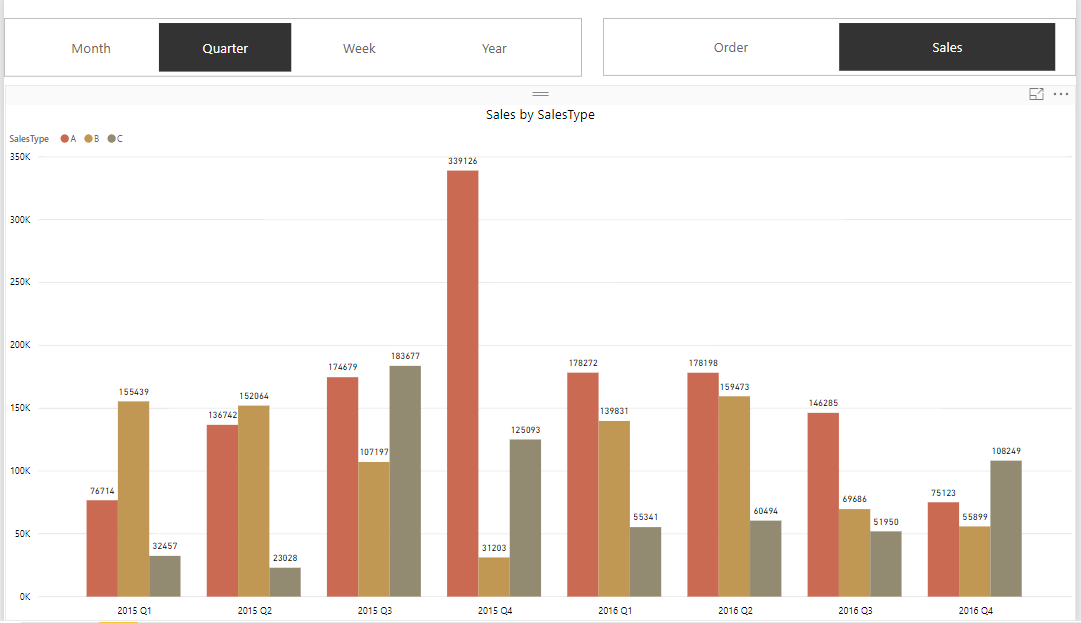
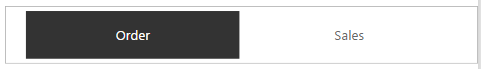
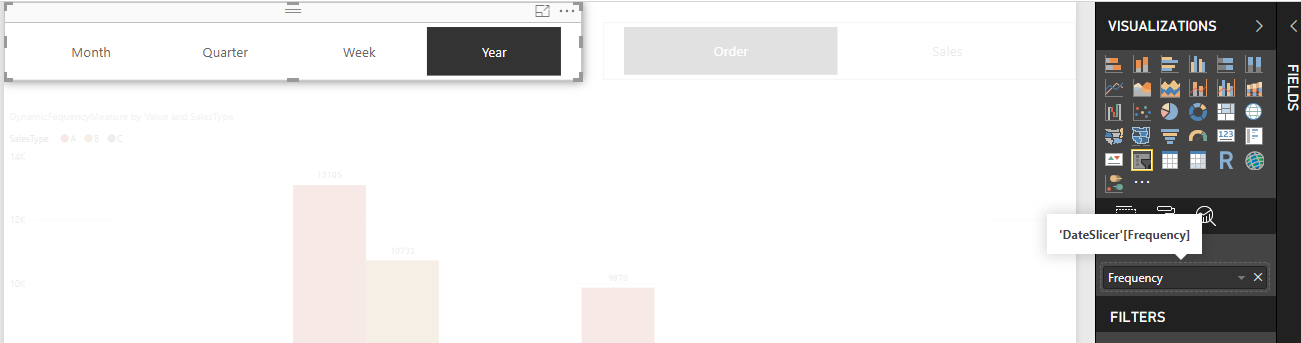
Add slicer for the month/quarter/week/year and plot ‘Frequency’ from the ‘DateSlicer’ table.
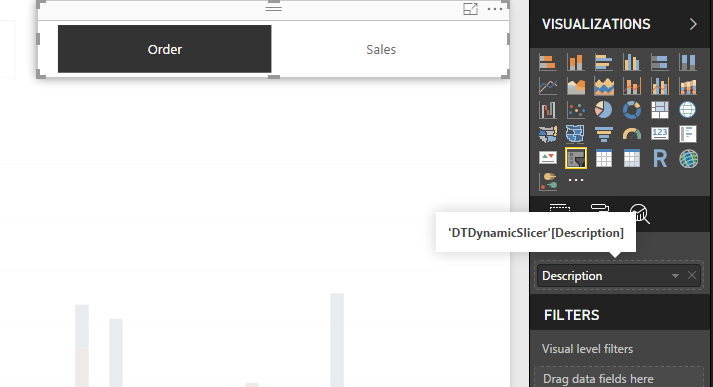
and add another slicer for choosing whether to show Sales data or Order data, which will be plotted from ‘DTDynamicSlicer’.
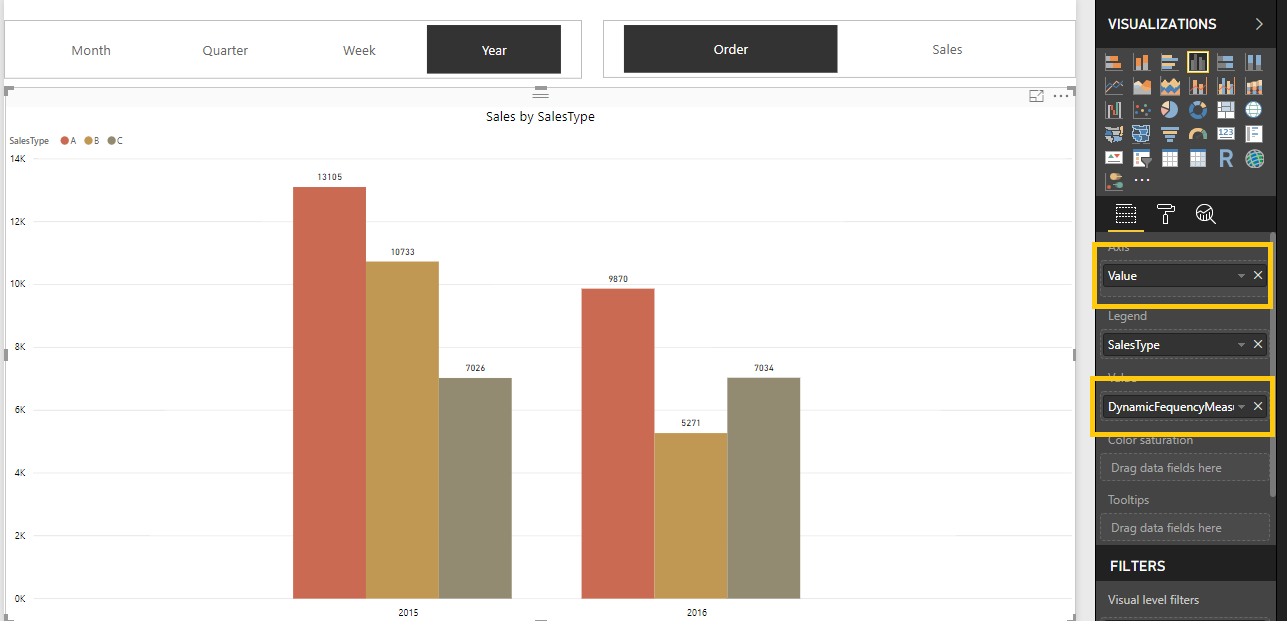
For the main visual, Axis will have ‘Value’ column from DateSlicer table and Value will have our created measure ‘DynamicFrequencyMeasure’.
Plot the visual as follows:
Let us understand how this works,
Suppose, the user selects ‘Week’ in date slicer and ‘Order’ in another slicer.
First, it will calculate DynamicFrequencyMeasure which in turn calculates DynamicValuesMeasure which calculates [Total Order] using the relationship between DTDates[Week] and DateSlicer[Value].
You can thus create dynamic visual with dynamic X-axis as well as dynamic Y-axis with any dynamic values you want with just the power of DAX.
Happy DAX-ting!


